Backstory
We’ve been having issues with a memory leak in several of our long-running application processes (queue consumers) for months.
As we deploy new versions to production more than 10 times per day, the issue was usually observable during the weekends. And since the affected processes were doing asynchronous data processing, it did not affect our customers in any way (our applications are stateless and we always care about proper DB transaction management).

The quick and simple (but definitely not proper) solution would be to simply increase the memory of failing consumers enough so that it’d survive the weekend and wait until another deployment. Such a solution did not satisfy ShipMonk engineers though as it’d potentially hide the issue till a later date when it may show up in a different scenario that would affect our customers! Therefore we decided to invest our time in investigating what’s going on.
A long cycle of trial and error began. We had 5 main suspects – the internal state \Doctrine\ORM\UnitOfWork, Datadog extension, logging configuration, metadata & query cache which utilize Opcache, and our implementation of Value objects which uses WeakReferences (topic for another article).
- As we clear the
EntityManagerboth before and after every transaction, it seemed very unlikely that this would be the cause. As the issue was affecting only some of our consumers with no recognizable pattern and no one else reported a similar issue on the doctrine GitHub repositories, we decided to focus on the other options. - Since we’re using Docker containers (running in Kubernetes) in all our environments (including local development), it was pretty easy to create a production image without Datadog APM extension and temporarily deploy the image only to selected consumers that we were having issues with. We discovered that the issue persisted so Datadog was out of the game.
- We’re using
\Symfony\Component\Cache\Adapter\PhpArrayAdapterto cache doctrine entity metadata and parsed queries which utilizes OPcache under the hood. Therefore we added monitoring of OPcache memory utilization which did not show any particular increases after the application went through the hot-path several times. - There is a verified memory leak in the
WeakReferenceimplementation although we made sure that it does not affect us, and wrote several unit tests checking the memory usage after common operations with our value objects. Nothing seemed to leak memory.
We were running on the latest PHP release (8.1.9) and there were no reported memory leaks in the php-src repository at the time of writing.
symfony/http-client – promising leak in stream_wrapper_register
After experimenting with our logging configuration, we found out that our application leaks memory when it sends errors to Sentry. What was exactly going on is well explained in https://github.com/php/php-src/issues/8548 – the issue was fixed in the PHP master branch but not backported to PHP <= 8.1 versions so symfony/http-client had to be patched.
We replaced the HTTP client implementation utilized by Sentry with guzzle/guzzle-client (that we were using for every other use-case already) in the meantime.
Unfortunately, as we soon found out, this was not the main source of the memory leak we were dealing with.
gc_collect_cycles to the rescue
As a last resort, although it seemed very unlikely, we decided to add gc_collect_cycles call before processing each message from the queue, just in case there was some issue with the GC. Suddenly, the memory usage stayed down and consistent.
This alone resolved our issue but we were not sure why and mainly what else may be affected. Therefore we started digging through the documentation and experimenting with sample scripts generating a ton of pure PHP objects.
Understanding how PHP manages memory allocations
PHP uses a combination of reference counting and a Garbage collector algorithm that collects objects containing cyclic dependencies. If you are not sure what some of these concepts mean, look at the official documentation or Better Understanding PHP’s Garbage Collection and come back, as both provide outdated information.
Look at the following script for a quick summary:
Beware that extensions like XDebug may modify the output!
<?php declare(strict_types = 1);

use function gc_collect_cycles;
use function debug_zval_dump;

class A {
    public function __construct(public readonly B $b) {}
}

class B {
    public function __construct(public ?A $a = null) {}
}

// Beware that debug_zval_dump utilises copy-on-write on the argument, so reported refcount is increased by 1
// https://www.php.net/manual/en/function.debug-zval-dump.php

$b = new B();
echo '$b refcount after $b assignment';
debug_zval_dump($b); // Will print 2 due to debug_zval_dump, actual refcount is 1

$a = new A($b);
echo '$a refcount after $a assignment';
debug_zval_dump($a); // Will print 2 due to debug_zval_dump, actual refcount is 1

$b->a = $a;
echo '$b refcount after cycle is created';
debug_zval_dump($b); // $b refcount == 2
echo '$a refcount after cycle is created';
debug_zval_dump($a); // $a refcount == 2

unset($b); // lowers reference count of $b to 1
unset($a); // lowers reference count of $a to 1

// GC required to collect the cycle! refcount will never go down to 0
// Both $b and $a are now registered as possible roots in GC root buffer (see gc_status['roots'])
echo 'GC status before gc_collect_cycles';
var_dump(gc_status());

gc_collect_cycles();

// Both $b and $a are collected, gc_status['roots'] is 0
echo 'GC status after gc_collect_cycles';
var_dump(gc_status());
In the following text, I’ll be referencing php/php-src source as of PHP 8.1.
The garbage collector code can be found in php-src/Zend/zend_gc.c. The main logic that we care about is related to the root buffer and its size.
An object is added to the root buffer every time its reference count is decreased to a non-zero value which can, in normal conditions, happen:
- Due to variable falling out of scope
- “Parent” object (holding a reference) being destroyed
From version 7.3 onwards, PHP no longer maintains a fixed size buffer for 10 000 roots (which is stated in documentation). When an object is supposed to be added to the root buffer and the buffer is full, gc_collect_cycles runs automatically and in case it manages to clear less than 100 objects (during this run), the threshold will be adjusted. That’s a very important improvement as previously, objects containing cycles that did not fit in the buffer were lost forever.
// The `count` variable is the number of freed objects during the last gc_collect_cycles() call
static void gc_adjust_threshold(int count)
{
	uint32_t new_threshold;

	/* TODO Very simple heuristic for dynamic GC buffer resizing:
	 * If there are "too few" collections, increase the collection threshold
	 * by a fixed step */
	if (count < GC_THRESHOLD_TRIGGER) {
		/* increase */
		if (GC_G(gc_threshold) < GC_THRESHOLD_MAX) {
			new_threshold = GC_G(gc_threshold) + GC_THRESHOLD_STEP;
			if (new_threshold > GC_THRESHOLD_MAX) {
				new_threshold = GC_THRESHOLD_MAX;
			}
			if (new_threshold > GC_G(buf_size)) {
				gc_grow_root_buffer();
			}
			if (new_threshold <= GC_G(buf_size)) {
				GC_G(gc_threshold) = new_threshold;
			}
		}
	} else if (GC_G(gc_threshold) > GC_THRESHOLD_DEFAULT) {
		new_threshold = GC_G(gc_threshold) - GC_THRESHOLD_STEP;
		if (new_threshold < GC_THRESHOLD_DEFAULT) {
			new_threshold = GC_THRESHOLD_DEFAULT;
		}
		GC_G(gc_threshold) = new_threshold;
	}
}
The size of the root buffer grows accordingly to match the threshold. However, whereas the threshold is lowered during the next GC iteration, the root buffer never shrinks back.
The values for the defaults and limits for threshold and buffer size are hard-coded in the zend_gc.c.
#define GC_DEFAULT_BUF_SIZE  (16 * 1024)
#define GC_BUF_GROW_STEP     (128 * 1024)

#define GC_MAX_UNCOMPRESSED  (512 * 1024)
#define GC_MAX_BUF_SIZE      0x40000000 // => Max root buffer size = 1 073 741 824 * sizeof(gc_root_buffer) B == 8GB

#define GC_THRESHOLD_DEFAULT (10000 + GC_FIRST_ROOT)
#define GC_THRESHOLD_STEP    10000 // Threshold always grows/shrinks by 10 000
#define GC_THRESHOLD_MAX     1000000000
#define GC_THRESHOLD_TRIGGER 100 // When less than 100 object is cleared during GC iteration, threshold grows
This looks like a very reasonable heuristics but there is a problem with this implementation. The GC at no point respects the memory limits. This may be a huge issue in some real-world cases and that partially explains what we were dealing with.
While working with our domain-specific entities, it’s not unusual to load hundreds of them in some cases (we’re not talking about inefficient queries but rather complex business logic) while some of them contain cyclic references to each other.
The internal state of EntityManager alongside operations like UnitOfWork::computeChangeset may be pretty heavy on user-land memory allocations while all those entities stay in the identity map. The root buffer may therefore get full and the threshold increases.
The combination of increased GC threshold between runs and large objects (which entities often) in the root buffer waiting for cleanup may result in Out of memory error even though the actual memory IN USE is way lower.
The following simple script demonstrates the issue:
<?php declare(strict_types = 1);

ini_set('memory_limit', '128M');

gc_enable();

class LargeObjectWithCyclicReference
{

    private const STR_LENGTH = 100_000;

    public string $str;

    public ?LargeObjectWithCyclicReference $other;

    public function __construct(?LargeObjectWithCyclicReference $other = null)
    {
        $this->str = '';
        for ($i = 0; $i < self::STR_LENGTH; $i++) {
            $this->str .= '.';
        }
        $this->other = $other;
    }

}

function test()
{
    for ($i = 0; $i < 2000; $i++) {
        $a = new LargeObjectWithCyclicReference();
        $b = new LargeObjectWithCyclicReference($a);
        $a->other = $b;

        if ($i % 100 === 0) {
            // Uncommenting the next line fixes the issue
            // gc_collect_cycles();
            echo $i . PHP_EOL;
        }
    }
}

test();
The script fails with Out of memory error even though the memory can easily be freed by GC. The allocated objects are simply too large and there is not enough of them (less than 10 000). If you uncomment the call to gc_collect_cycles, the script will run just with consistent memory usage.
We tried to wrap our heads around this limitation and explain why it applied to our case, since adding a manual call to gc_collect_cycles() before processing every message helped to mitigate the issue 🤨.
Finding a bug in PHP GC
The following only affects PHP 8.1 and was fixed by https://github.com/php/php-src/pull/9265. PHP 8.1.10 contains the fix.
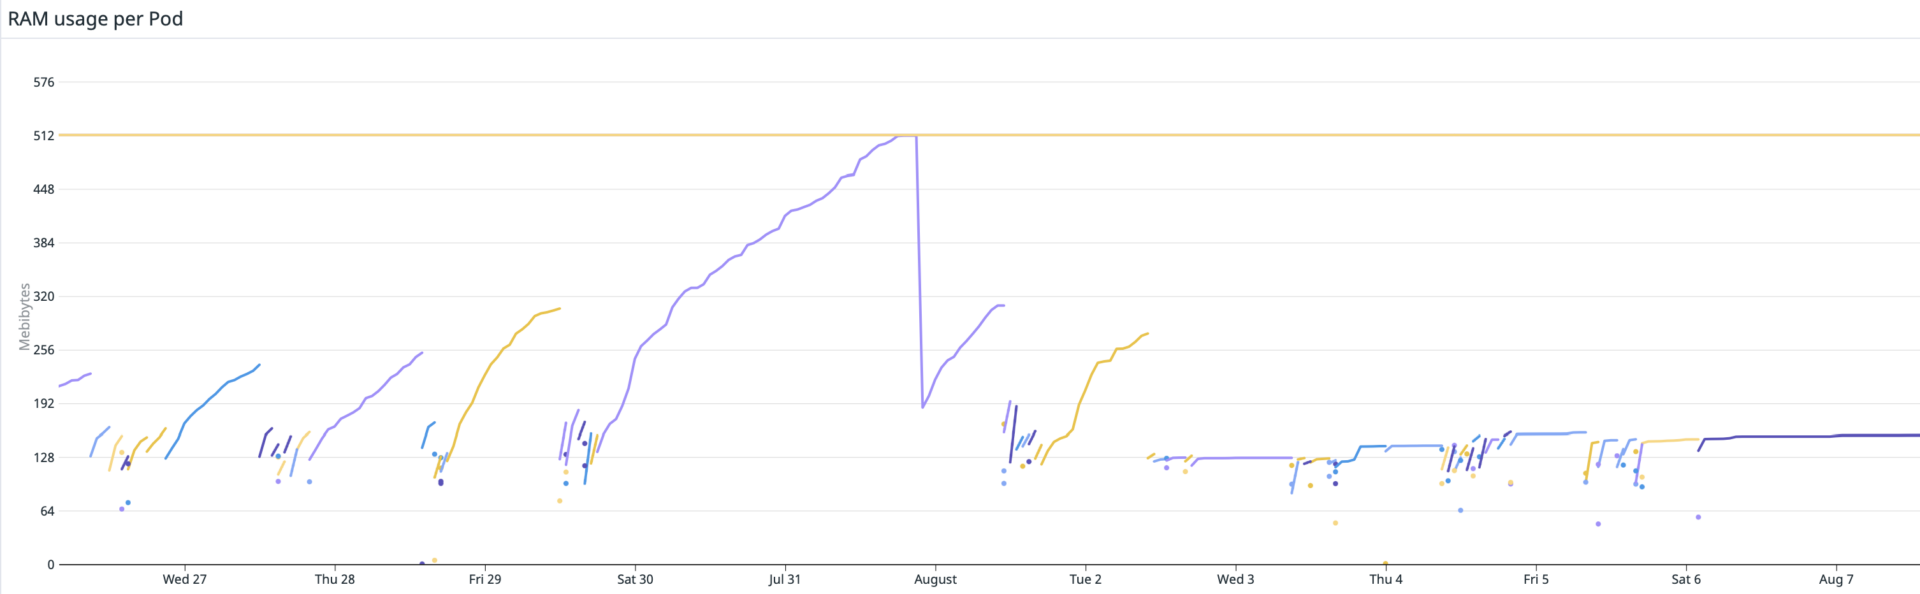
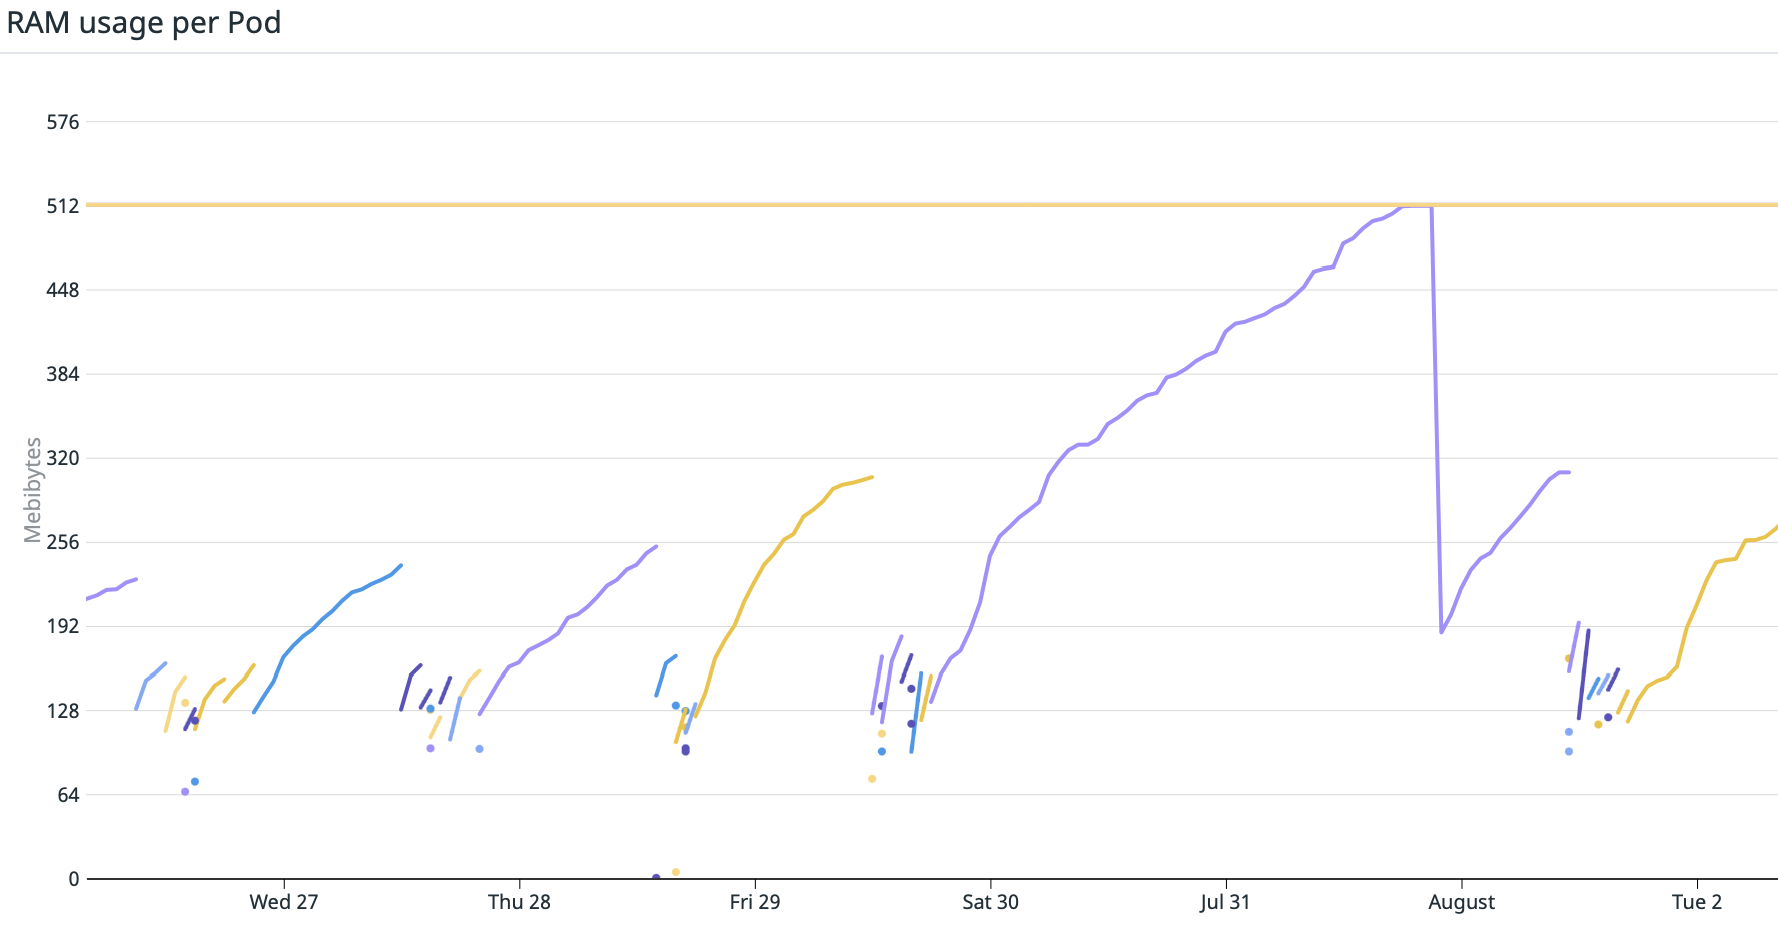
Even though the above-presented issue may cause problems in low-memory environments, our application seemed to require more than 1GB after several days of running. This just did not make sense so we had to dig deeper.
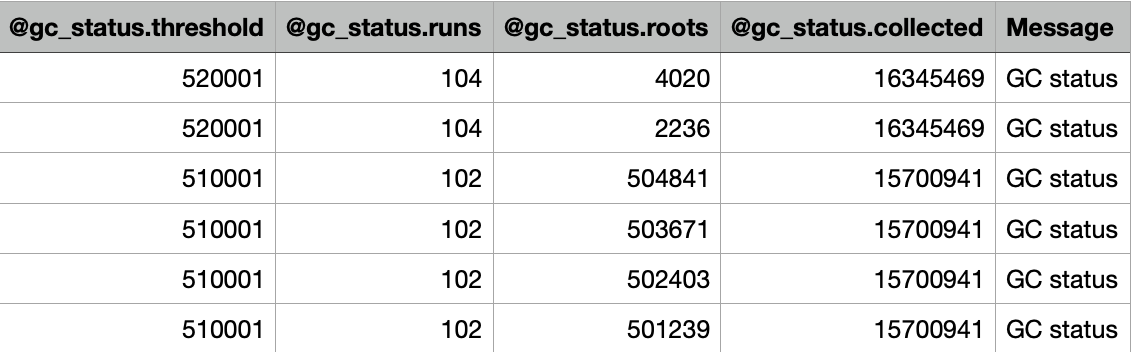
After carefully monitoring the output of gc_status() at several places in code, we discovered that the GC threshold (and the root buffer alongside it) is growing to insane numbers and it never goes down even for a single iteration.
Therefore we decided to compile PHP from the source and step debug what’s going on inside the engine on many test scripts.
As presented earlier, the size of the root buffer is dependent on the number of collected objects during the most recent GC run. From inspecting the zend_gc.c source code, we found that when an object with a custom __destruct method is a part of a possible cycle, the PHP GC may run twice. The problem is that the collected count is reset during the second run! Few or no objects may be collected then and the root buffer grows indefinitely!
gc_adjust_threshold(zend_gc_collect_cycles());

ZEND_API int zend_gc_collect_cycles(void)
{
	int count = 0;
	bool should_rerun_gc = 0;
	bool did_rerun_gc = 0;

rerun_gc:
	if (GC_G(num_roots)) {
		gc_root_buffer *current, *last;
		zend_refcounted *p;

		///
		...
        ///

		GC_TRACE("Collecting roots");
		count = gc_collect_roots(&gc_flags, &stack) // Rewriting count! variable

	///
	...
	///
	return count;
The issue is described in https://github.com/php/php-src/issues/9266 and we managed to fix the issue in https://github.com/php/php-src/pull/9265.
🥳🥳🥳 gc_collect_cycles is no longer needed and the GC scheduling is largely improved even in other cases, lowering our memory footprint significantly. 🥳🥳🥳